Bigger budget, better returns
Most brands find that the more they spend, the less each pound brings back. This one went the other way.
- 3.5xRevenue across Meta and Google, January to March 2026 against the same quarter in 2025£77,038 against £21,903
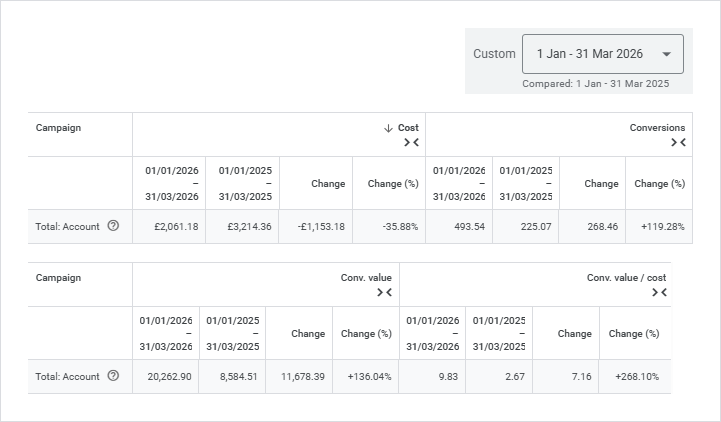
- 9.83xReturn on Google ad spendUp from 2.67x, on 36% less spend
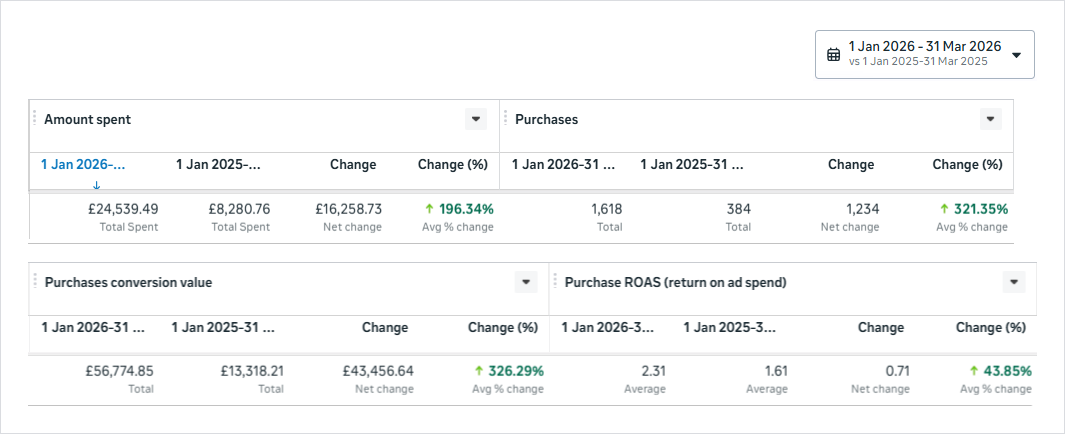
- +321%Purchases from Meta1,618 against 384
The challenge
Beer is one of the most crowded categories in Britain, and the household names have deep pockets. For a challenger brand online, the usual story is that every extra pound of ad spend brings back a little less than the one before. The first quarter makes it harder still, with Dry January and tight post-Christmas budgets.
The brand wanted to grow quickly. Our job was to make sure that growth paid for itself.
What we did
Made creative the engine on Meta.
Instead of leaning on a few ads until people tired of them, we kept a steady rhythm of fresh, topical campaigns built around the drinks calendar, from Christmas into the New Year, alongside brand, press and partnership activity. There was always something new to notice.
Tightened Google right up.
We kept the account to two focused campaigns, Search and Performance Max, cut the budget by 36% and made each one earn its keep. Search went from 1.38x to 5.02x, and Performance Max from 4.35x to 15.08x.
Scaled in steps.
We grew the budget gradually through 2025 rather than all at once, so each increase had to prove itself before the next. By the first quarter of 2026, the brand was investing more than twice as much each month as it had a year before.
The results
| Measure | Q1 2025 | Q1 2026 | Change |
|---|---|---|---|
| Ad spend | £8,280.76 | £24,539.49 | +196.3% |
| Purchases | 384 | 1,618 | +321.4% |
| Revenue | £13,318.21 | £56,774.85 | +326.3% |
| Return on ad spend | 1.61x | 2.31x | +43.9% |
| Cost per purchase | £21.56 | £15.17 | 29.7% lower |
| Measure | Q1 2025 | Q1 2026 | Change |
|---|---|---|---|
| Ad spend | £3,214.36 | £2,061.18 | 35.9% lower |
| Conversions | 225.07 | 493.54 | +119.3% |
| Revenue | £8,584.51 | £20,262.90 | +136.0% |
| Return on ad spend | 2.67x | 9.83x | +268.1% |
| Cost per conversion | £14.28 | £4.18 | 70.8% lower |
| Measure | Q1 2025 | Q1 2026 | Change |
|---|---|---|---|
| Ad spend | £11,495.12 | £26,600.67 | +131.4% |
| Revenue | £21,902.72 | £77,037.75 | +251.7% |
| Blended return | 1.91x | 2.90x | +52.0% |
Three first quarters on Google
Return on Google ad spend, January to March each year.
Bar chart. Q1 2024: 0.87x; Q1 2025: 2.67x; Q1 2026: 9.83x.
Show the numbers
| Period | Return on Google ad spend |
|---|---|
| Q1 2024 | 0.87x |
| Q1 2025 | 2.67x |
| Q1 2026 | 9.83x |
Budget in, revenue out
Ad spend and revenue across Meta and Google, January to March.
- Ad spend
- Revenue
Bar chart. Q1 2025: Ad spend £11,495, Revenue £21,903; Q1 2026: Ad spend £26,601, Revenue £77,038.
Show the numbers
| Period | Ad spend | Revenue |
|---|---|---|
| Q1 2025 | £11,495.12 | £21,902.72 |
| Q1 2026 | £26,600.67 | £77,037.75 |
Every month of the quarter grew
Meta revenue by month, January to March.
- 2025
- 2026
Bar chart. January: 2025 £4,001, 2026 £16,103; February: 2025 £4,061, 2026 £17,628; March: 2025 £5,256, 2026 £23,044.
Show the numbers
| Period | 2025 | 2026 |
|---|---|---|
| January | £4,001.40 | £16,102.89 |
| February | £4,060.55 | £17,628.23 |
| March | £5,256.27 | £23,043.77 |
In context
The typical return for food and beverage brands is 1.61x on Meta and 3.18x on Google (Triple Whale global medians, August 2025 to July 2026). This brand reached 2.31x on Meta and 9.83x on Google, in one of the toughest quarters of the year for beer.
What this means
The budget more than doubled, and the return still went up on both channels. That’s the point where a brand stops buying growth and starts building it.
Against the industry benchmark
- This brand
- Food and beverage median
Bar chart. Meta: This brand, Q1 2026 2.31x, Food and beverage median 1.61x; Google: This brand, Q1 2026 9.83x, Food and beverage median 3.18x.
Show the numbers
| Channel | This brand | Median |
|---|---|---|
| Meta | 2.31xThis brand, Q1 2026 | 1.61xFood and beverage median |
| 9.83xThis brand, Q1 2026 | 3.18xFood and beverage median |
The proof
 Open the full-size screenshot
 Open the full-size screenshot
What it means for you